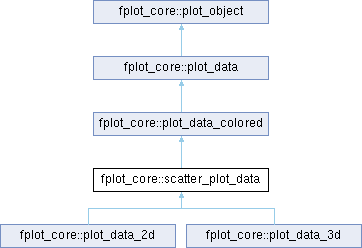
A plot_data object for describing scatter plot data sets. More...
Public Member Functions | |
| procedure, public | get_command_string spd_get_cmd |
| Gets the GNUPLOT command string to represent this scatter_plot_data object. | |
| procedure, public | get_line_width spd_get_line_width |
| Gets the width of the line, in pixels. | |
| procedure, public | set_line_width spd_set_line_width |
| Sets the width of the line, in pixels. | |
| procedure, public | get_line_style spd_get_line_style |
| Gets the line style. | |
| procedure, public | set_line_style spd_set_line_style |
| Sets the line style. | |
| procedure, public | get_draw_line spd_get_draw_line |
| Gets a value determining if a line should be drawn. | |
| procedure, public | set_draw_line spd_set_draw_line |
| Sets a value determining if a line should be drawn. | |
| procedure, public | get_draw_markers spd_get_draw_markers |
| Gets a value determining if data point markers should be drawn. | |
| procedure, public | set_draw_markers spd_set_draw_markers |
| Sets a value determining if data point markers should be drawn. | |
| procedure, public | get_marker_style spd_get_marker_style |
| Gets the marker style. | |
| procedure, public | set_marker_style spd_set_marker_style |
| Sets the marker style. | |
| procedure, public | get_marker_scaling spd_get_marker_scaling |
| Gets the marker scaling. | |
| procedure, public | set_marker_scaling spd_set_marker_scaling |
| Sets the marker scaling. | |
| procedure, public | get_marker_frequency spd_get_marker_frequency |
| Gets the marker frequency. | |
| procedure, public | set_marker_frequency spd_set_marker_frequency |
| Sets the marker frequency. | |
| procedure(spd_get_int_value), deferred, public | get_count spd_get_int_value |
| Gets the number of data points. | |
| procedure(spd_get_value), deferred, public | get_x spd_get_value |
| Gets the requested X data point. | |
| procedure(spd_set_value), deferred, public | set_x spd_set_value |
| Sets the requested X data point. | |
| procedure(spd_get_value), deferred, public | get_y spd_get_value |
| Gets the requested Y data point. | |
| procedure(spd_set_value), deferred, public | set_y spd_set_value |
| Sets the requested X data point. | |
| procedure(spd_get_string_result), deferred, public | get_axes_string spd_get_string_result |
| Gets the GNUPLOT command string defining which axes the data is to be plotted against. | |
| procedure, public | get_simplify_data spd_get_simplify_data |
| Gets a value determining if the stored data should be simplified (reduced) before passing to GNUPLOT. | |
| procedure, public | set_simplify_data spd_set_simplify_data |
| Sets a value determining if the stored data should be simplified (reduced) before passing to GNUPLOT. | |
| procedure, public | get_simplification_factor spd_get_simplify_factor |
| Gets a factor used to establish the simplification tolerance. | |
| procedure, public | set_simplification_factor spd_set_simplify_factor |
| Sets a factor used to establish the simplification tolerance. The tolerance is established by multplying this factor by the range of the dependent variable data. | |
| procedure, public | get_use_data_dependent_colors spd_get_data_dependent_colors |
| Gets a value determing if data-dependent colors should be used. | |
| procedure, public | set_use_data_dependent_colors spd_set_data_dependent_colors |
| Sets a value determing if data dependent colors should be used. | |
| procedure, public | get_fill_curve spd_get_filled |
| Gets a logical value determining if a filled curve should be drawn. | |
| procedure, public | set_fill_curve spd_set_filled |
| Sets a logical value determining if a filled curve should be drawn. | |
| procedure, public | get_use_variable_size_points spd_get_use_var_point_size |
| Gets a logical value determining if variable sized data points should be used. The default is false, such that points will be of a constant size. | |
| procedure, public | set_use_variable_size_points spd_set_use_var_point_size |
| Sets a logical value determining if variable sized data points should be used. The default is false, such that points will be of a constant size. | |
 Public Member Functions inherited from fplot_core::plot_data_colored Public Member Functions inherited from fplot_core::plot_data_colored | |
| procedure, public | get_line_color pdc_get_line_color |
| Gets the line color. | |
| procedure, public | set_line_color pdc_set_line_color |
| Sets the line color. | |
| Public Member Functions inherited from fplot_core::plot_data | |
| procedure, public | get_name pd_get_name |
| Gets the name to associate with this data set. | |
| procedure, public | set_name pd_set_name |
| Sets the name to associate with this data set. | |
| procedure(pd_get_string_result), deferred, public | get_data_string pd_get_string_result |
| Gets the GNUPLOT command string containing the actual data to plot. | |
Public Attributes | |
| logical | m_drawmarkers = .false. |
| Draw the markers? | |
| integer(int32) | m_markerfrequency = 1 |
| Marker frequency. | |
| real(real32) | m_linewidth = 1.0 |
| Line width. | |
| integer(int32) | m_linestyle = LINE_SOLID |
| Line style. | |
| integer(int32) | m_markertype = MARKER_X |
| Marker type. | |
| real(real32) | m_markersize = 1.0 |
| Marker size multiplier. | |
| logical | m_simplifydata = .true. |
| True if large data sets should be simplified before sending to GNUPLOT. | |
| real(real64) | m_simplifyfactor = 1.0d-3 |
| A scaling factor used to establish the simplification tolerance. The simplification tolerance is established by multiplying this factor by the range in the dependent variable data. | |
| logical | m_datadependentcolors = .false. |
| Determines if the data should utilize data-dependent colors. | |
| logical | m_filledcurve = .false. |
| Fill the curve? | |
| logical | m_usevariablesizepoints = .false. |
| Use variable size data points? | |
| Public Attributes inherited from fplot_core::plot_data_colored | |
| logical | m_useautocolor = .true. |
| Let the object choose colors automatically. | |
| integer(int32) | m_colorindex = 1 |
| The color index to use, assuming we're using auto color. | |
Private Attributes | |
| logical | m_drawline = .true. |
| Draw the line? | |
Detailed Description
A plot_data object for describing scatter plot data sets.
Definition at line 3546 of file fplot_core.f90.
Member Function/Subroutine Documentation
◆ get_axes_string()
|
pure virtual |
Gets the GNUPLOT command string defining which axes the data is to be plotted against.
Implemented in fplot_core::plot_data_2d, and fplot_core::plot_data_3d.
Definition at line 3779 of file fplot_core.f90.
◆ get_command_string()
|
virtual |
Gets the GNUPLOT command string to represent this scatter_plot_data object.
- Syntax
- character(len = :) function, allocatable get_command_string(class(scatter_plot_data) this)
- Parameters
-
[in] this The scatter_plot_data object.
- Returns
- The command string.
Implements fplot_core::plot_object.
Definition at line 3586 of file fplot_core.f90.
◆ get_count()
|
pure virtual |
Gets the number of data points.
Implemented in fplot_core::plot_data_2d, and fplot_core::plot_data_3d.
Definition at line 3768 of file fplot_core.f90.
◆ get_draw_line()
| procedure, public fplot_core::scatter_plot_data::get_draw_line |
Gets a value determining if a line should be drawn.
- Syntax
- pure logical function get_draw_line(class(scatter_plot_data) this)
- Parameters
-
[in] this The scatter_plot_data object.
- Returns
- Returns true if the line should be drawn; else, false.
Definition at line 3647 of file fplot_core.f90.
◆ get_draw_markers()
| procedure, public fplot_core::scatter_plot_data::get_draw_markers |
Gets a value determining if data point markers should be drawn.
- Syntax
- pure logical function get_draw_markers(class(scatter_plot_data) this)
- Parameters
-
[in] this The scatter_plot_data object.
- Returns
- Returns true if the markers should be drawn; else, false.
Definition at line 3668 of file fplot_core.f90.
◆ get_fill_curve()
| procedure, public fplot_core::scatter_plot_data::get_fill_curve |
Gets a logical value determining if a filled curve should be drawn.
- Syntax
- logical function get_fill_curve(class(scatter_plot_data) this)
- Parameters
-
[in] this The scatter_plot_data object.
- Returns
- Returns true if the curve should be filled; else, false.
Definition at line 3862 of file fplot_core.f90.
◆ get_line_style()
| procedure, public fplot_core::scatter_plot_data::get_line_style |
Gets the line style.
- Syntax
- pure integer(int32) function get_line_style(class(scatter_plot_data) this)
- Parameters
-
[in] this The scatter_plot_data object.
- Returns
- The line style. The line style must be one of the following:
- LINE_DASHED
- LINE_DASH_DOTTED
- LINE_DASH_DOT_DOT
- LINE_DOTTED
- LINE_SOLID
Definition at line 3621 of file fplot_core.f90.
◆ get_line_width()
| procedure, public fplot_core::scatter_plot_data::get_line_width |
Gets the width of the line, in pixels.
- Syntax
- pure real(real32) function get_line_width(class(scatter_plot_data) this)
- Parameters
-
[in] this The scatter_plot_data object.
- Returns
- The line width.
Definition at line 3596 of file fplot_core.f90.
◆ get_marker_frequency()
| procedure, public fplot_core::scatter_plot_data::get_marker_frequency |
Gets the marker frequency.
- Syntax
- pure integer(int32) function get_marker_frequency(class(scatter_plot_data) this)
- Parameters
-
[in] this The scatter_plot_data object.
- Returns
- The marker frequency.
Definition at line 3756 of file fplot_core.f90.
◆ get_marker_scaling()
| procedure, public fplot_core::scatter_plot_data::get_marker_scaling |
Gets the marker scaling.
- Syntax
- pure real(real32) function get_marker_scaling(class(scatter_plot_data) this)
- Parameters
-
[in] this The scatter_plot_data object.
- Returns
- The scaling factor.
Definition at line 3736 of file fplot_core.f90.
◆ get_marker_style()
| procedure, public fplot_core::scatter_plot_data::get_marker_style |
Gets the marker style.
- Syntax
- pure integer(int32) function get_marker_style(class(scatter_plot_data) this)
- Parameters
-
[in] this The scatter_plot_data object.
- Returns
- The marker type. The marker type must be one of the following:
- MARKER_ASTERISK
- MARKER_EMPTY_CIRCLE
- MARKER_EMPTY_NABLA
- MARKER_EMPTY_RHOMBUS
- MARKER_EMPTY_SQUARE
- MARKER_EMPTY_TRIANGLE
- MARKER_FILLED_CIRCLE
- MARKER_FILLED_NABLA
- MARKER_FILLED_RHOMBUS
- MARKER_FILLED_SQUARE
- MARKER_FILLED_TRIANGLE
- MARKER_PLUS
- MARKER_X
Definition at line 3702 of file fplot_core.f90.
◆ get_simplification_factor()
| procedure, public fplot_core::scatter_plot_data::get_simplification_factor |
Gets a factor used to establish the simplification tolerance.
- Syntax
- pure real(real64) function get_simplification_factor(class(scatter_plot_data) this)
- Parameters
-
[in] this The scatter_plot_data object.
- Returns
- Returns the scaling factor.
Definition at line 3813 of file fplot_core.f90.
◆ get_simplify_data()
| procedure, public fplot_core::scatter_plot_data::get_simplify_data |
Gets a value determining if the stored data should be simplified (reduced) before passing to GNUPLOT.
- Syntax
- pure logical function get_simplify_data(class(scatter_plot_data) this)
- Parameters
-
[in] this The scatter_plot_data object.
- Returns
- Returns true if the data should be simplified prior to sending to GNUPLOT; else, false to leave the data alone.
Definition at line 3791 of file fplot_core.f90.
◆ get_use_data_dependent_colors()
| procedure, public fplot_core::scatter_plot_data::get_use_data_dependent_colors |
Gets a value determing if data-dependent colors should be used.
- Syntax
- pure logical function get_use_data_dependent_colors(class(scatter_plot_data) this)
- Parameters
-
[in] this The scatter_plot_data object.
- Returns
- Returns true if data-dependent colors should be used; else, false.
Definition at line 3837 of file fplot_core.f90.
◆ get_use_variable_size_points()
| procedure, public fplot_core::scatter_plot_data::get_use_variable_size_points |
Gets a logical value determining if variable sized data points should be used. The default is false, such that points will be of a constant size.
- Syntax
- pure logical function get_use_variable_size_points(class(scatter_plot_data) this)
- Parameters
-
[in] this The scatter_plot_data object.
- Returns
- True if variable size points should be used; else, false.
Definition at line 3885 of file fplot_core.f90.
◆ get_x()
|
pure virtual |
Gets the requested X data point.
Implemented in fplot_core::plot_data_2d, and fplot_core::plot_data_3d.
Definition at line 3770 of file fplot_core.f90.
◆ get_y()
|
pure virtual |
Gets the requested Y data point.
Implemented in fplot_core::plot_data_2d, and fplot_core::plot_data_3d.
Definition at line 3774 of file fplot_core.f90.
◆ set_draw_line()
| procedure, public fplot_core::scatter_plot_data::set_draw_line |
Sets a value determining if a line should be drawn.
- Syntax
- subroutine set_draw_line(class(scatter_plot_data) this, logical x)
- Parameters
-
[in,out] this The scatter_plot_data object. [in] x Set to true if the line should be drawn; else, false.
Definition at line 3657 of file fplot_core.f90.
◆ set_draw_markers()
| procedure, public fplot_core::scatter_plot_data::set_draw_markers |
Sets a value determining if data point markers should be drawn.
- Syntax
- subroutine set_draw_markers(class(scatter_plot_data) this, logical x)
- Parameters
-
[in,out] this The scatter_plot_data object. [in] x Set to true if the markers should be drawn; else, false.
Definition at line 3679 of file fplot_core.f90.
◆ set_fill_curve()
| procedure, public fplot_core::scatter_plot_data::set_fill_curve |
Sets a logical value determining if a filled curve should be drawn.
- Syntax
- subroutine set_fill_curve(class(scatter_plot_data) this, logical x)
- Parameters
-
[in,out] this The scatter_plot_data object. [in] Set to true if the curve should be filled; else, false.
Definition at line 3873 of file fplot_core.f90.
◆ set_line_style()
| procedure, public fplot_core::scatter_plot_data::set_line_style |
Sets the line style.
- Syntax
- subroutine set_line_style(class(scatter_plot_data) this, integer(int32) x)
- Parameters
-
[in,out] this The scatter_plot_data object. [in] x The line style. The line style must be one of the following: - LINE_DASHED
- LINE_DASH_DOTTED
- LINE_DASH_DOT_DOT
- LINE_DOTTED
- LINE_SOLID
Definition at line 3637 of file fplot_core.f90.
◆ set_line_width()
| procedure, public fplot_core::scatter_plot_data::set_line_width |
Sets the width of the line, in pixels.
- Syntax
- subroutine set_line_width(class(scatter_plot_data) this, real(real32) x)
- Parameters
-
[in,out] this The scatter_plot_data object. [in] x The line width.
Definition at line 3606 of file fplot_core.f90.
◆ set_marker_frequency()
| procedure, public fplot_core::scatter_plot_data::set_marker_frequency |
Sets the marker frequency.
- Syntax
- subroutine set_marker_frequency(class(scatter_plot_data) this, integer(int32) x)
- Parameters
-
[in,out] this The scatter_plot_data object. [in] x The marker frequency.
Definition at line 3766 of file fplot_core.f90.
◆ set_marker_scaling()
| procedure, public fplot_core::scatter_plot_data::set_marker_scaling |
Sets the marker scaling.
- Syntax
- subroutine set_marker_scaling(class(scatter_plot_data) this, real(real32) x)
- Parameters
-
[in,out] this The scatter_plot_data object. [in] x The scaling factor.
Definition at line 3746 of file fplot_core.f90.
◆ set_marker_style()
| procedure, public fplot_core::scatter_plot_data::set_marker_style |
Sets the marker style.
- Syntax
- subroutine set_marker_style(class(scatter_plot_data) this, integer(int32) x)
- Parameters
-
[in,out] this The scatter_plot_data object. [in] x The marker type. The marker type must be one of the following: - MARKER_ASTERISK
- MARKER_EMPTY_CIRCLE
- MARKER_EMPTY_NABLA
- MARKER_EMPTY_RHOMBUS
- MARKER_EMPTY_SQUARE
- MARKER_EMPTY_TRIANGLE
- MARKER_FILLED_CIRCLE
- MARKER_FILLED_NABLA
- MARKER_FILLED_RHOMBUS
- MARKER_FILLED_SQUARE
- MARKER_FILLED_TRIANGLE
- MARKER_PLUS
- MARKER_X
Definition at line 3726 of file fplot_core.f90.
◆ set_simplification_factor()
| procedure, public fplot_core::scatter_plot_data::set_simplification_factor |
Sets a factor used to establish the simplification tolerance. The tolerance is established by multplying this factor by the range of the dependent variable data.
- Syntax
- subroutine set_simplification_factor(class(scatter_plot_data) this, real(real64) x)
- Parameters
-
[in,out] this The scatter_plot_data object. [in] x The scaling factor.
Definition at line 3825 of file fplot_core.f90.
◆ set_simplify_data()
| procedure, public fplot_core::scatter_plot_data::set_simplify_data |
Sets a value determining if the stored data should be simplified (reduced) before passing to GNUPLOT.
- Syntax
- subroutine set_simplify_data(class(scatter_plot_data) this, logical x)
- Parameters
-
[in,out] this The scatter_plot_data object. [in] x True if the data should be simplified prior to sending to GNUPLOT; else, false to leave the data alone.
Definition at line 3803 of file fplot_core.f90.
◆ set_use_data_dependent_colors()
| procedure, public fplot_core::scatter_plot_data::set_use_data_dependent_colors |
Sets a value determing if data dependent colors should be used.
- Syntax
- subroutine set_use_data_dependent_colors(class(scatter_plot_data) this, logical x)
- Parameters
-
[in,out] this The scatter_plot_data object. [in] x True if data-dependent colors should be used; else, false.
Definition at line 3850 of file fplot_core.f90.
◆ set_use_variable_size_points()
| procedure, public fplot_core::scatter_plot_data::set_use_variable_size_points |
Sets a logical value determining if variable sized data points should be used. The default is false, such that points will be of a constant size.
- Syntax
- subroutine set_use_variable_size_points(class(scatter_plot_data) this, logical x)
- Parameters
-
[in] this The scatter_plot_data object. [in] x True if variable size points should be used; else, false.
Definition at line 3898 of file fplot_core.f90.
◆ set_x()
|
pure virtual |
Sets the requested X data point.
Implemented in fplot_core::plot_data_2d, and fplot_core::plot_data_3d.
Definition at line 3772 of file fplot_core.f90.
◆ set_y()
|
pure virtual |
Sets the requested X data point.
Implemented in fplot_core::plot_data_2d, and fplot_core::plot_data_3d.
Definition at line 3776 of file fplot_core.f90.
Member Data Documentation
◆ m_datadependentcolors
| logical fplot_core::scatter_plot_data::m_datadependentcolors = .false. |
Determines if the data should utilize data-dependent colors.
Definition at line 3570 of file fplot_core.f90.
◆ m_drawline
|
private |
Draw the line?
Definition at line 3549 of file fplot_core.f90.
◆ m_drawmarkers
| logical fplot_core::scatter_plot_data::m_drawmarkers = .false. |
Draw the markers?
Definition at line 3551 of file fplot_core.f90.
◆ m_filledcurve
| logical fplot_core::scatter_plot_data::m_filledcurve = .false. |
Fill the curve?
Definition at line 3572 of file fplot_core.f90.
◆ m_linestyle
| integer(int32) fplot_core::scatter_plot_data::m_linestyle = LINE_SOLID |
Line style.
Definition at line 3557 of file fplot_core.f90.
◆ m_linewidth
| real(real32) fplot_core::scatter_plot_data::m_linewidth = 1.0 |
Line width.
Definition at line 3555 of file fplot_core.f90.
◆ m_markerfrequency
| integer(int32) fplot_core::scatter_plot_data::m_markerfrequency = 1 |
Marker frequency.
Definition at line 3553 of file fplot_core.f90.
◆ m_markersize
| real(real32) fplot_core::scatter_plot_data::m_markersize = 1.0 |
Marker size multiplier.
Definition at line 3561 of file fplot_core.f90.
◆ m_markertype
| integer(int32) fplot_core::scatter_plot_data::m_markertype = MARKER_X |
Marker type.
Definition at line 3559 of file fplot_core.f90.
◆ m_simplifydata
| logical fplot_core::scatter_plot_data::m_simplifydata = .true. |
True if large data sets should be simplified before sending to GNUPLOT.
Definition at line 3564 of file fplot_core.f90.
◆ m_simplifyfactor
| real(real64) fplot_core::scatter_plot_data::m_simplifyfactor = 1.0d-3 |
A scaling factor used to establish the simplification tolerance. The simplification tolerance is established by multiplying this factor by the range in the dependent variable data.
Definition at line 3568 of file fplot_core.f90.
◆ m_usevariablesizepoints
| logical fplot_core::scatter_plot_data::m_usevariablesizepoints = .false. |
Use variable size data points?
Definition at line 3574 of file fplot_core.f90.
The documentation for this type was generated from the following file:
- D:/Code/fplot-1/src/fplot_core.f90