

|
fplot 1.7.1
A Fortran library providing a convenient interface for plotting with Gnuplot.
|
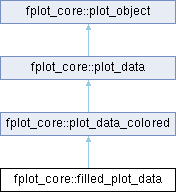
Defines a two-dimensional filled plot data set. More...
Public Member Functions | |
| procedure, public | get_axes_string fpd_get_axes_cmd |
| Gets the GNUPLOT command string defining which axes the data is to be plotted against. | |
| procedure, public | get_draw_against_y2 fpd_get_draw_against_y2 |
| Gets a value determining if the data should be plotted against the secondary y-axis. | |
| procedure, public | set_draw_against_y2 fpd_set_draw_against_y2 |
| Sets a value determining if the data should be plotted against the secondary y-axis. | |
| procedure, public | get_command_string fpd_get_cmd |
| Gets the GNUPLOT command string to represent this filled_plot_data object. | |
| procedure, public | get_data_string fpd_get_data_cmd |
| Gets the GNUPLOT command string containing the actual data to plot. | |
| procedure, public | define_data fpd_define_data |
| Defines the data set. | |
 Public Member Functions inherited from fplot_core::plot_data_colored Public Member Functions inherited from fplot_core::plot_data_colored | |
| procedure, public | get_line_color pdc_get_line_color |
| Gets the line color. | |
| procedure, public | set_line_color pdc_set_line_color |
| Sets the line color. | |
| Public Member Functions inherited from fplot_core::plot_data | |
| procedure, public | get_name pd_get_name |
| Gets the name to associate with this data set. | |
| procedure, public | set_name pd_set_name |
| Sets the name to associate with this data set. | |
Public Attributes | |
| real(real64), dimension(:,:), allocatable | m_data |
| The data set (column 1 = x, column 2 = y, column 3 = constraint y) | |
| Public Attributes inherited from fplot_core::plot_data_colored | |
| logical | m_useautocolor = .true. |
| Let the object choose colors automatically. | |
| integer(int32) | m_colorindex = 1 |
| The color index to use, assuming we're using auto color. | |
Private Attributes | |
| logical | m_usey2 = .false. |
| Plot against the secondary y-axis. | |
Defines a two-dimensional filled plot data set.
Definition at line 7586 of file fplot_core.f90.
| procedure, public fplot_core::filled_plot_data::define_data |
Defines the data set.
| [in,out] | this | The filled_plot_data object. |
| [in] | x | An N-element array containing the x coordinate data. |
| [in] | y | An N-element array containing the y coordinate data. |
| [in] | yc | An N-element array containing the constraining curve y coordinate data. |
| [out] | err | An optional errors-based object that if provided can be used to retrieve information relating to any errors encountered during execution. If not provided, a default implementation of the errors class is used internally to provide error handling. Possible errors and warning messages that may be encountered are as follows.
|
Definition at line 7669 of file fplot_core.f90.
| procedure, public fplot_core::filled_plot_data::get_axes_string |
Gets the GNUPLOT command string defining which axes the data is to be plotted against.
| [in] | this | The filled_plot_data object. |
Definition at line 7603 of file fplot_core.f90.
|
virtual |
Gets the GNUPLOT command string to represent this filled_plot_data object.
| [in] | this | The filled_plot_data object. |
Implements fplot_core::plot_object.
Definition at line 7638 of file fplot_core.f90.
|
virtual |
Gets the GNUPLOT command string containing the actual data to plot.
| [in] | this | The filled_plot_data object. |
Implements fplot_core::plot_data.
Definition at line 7649 of file fplot_core.f90.
| procedure, public fplot_core::filled_plot_data::get_draw_against_y2 |
Gets a value determining if the data should be plotted against the secondary y-axis.
| [in] | this | The filled_plot_data object. |
Definition at line 7615 of file fplot_core.f90.
| procedure, public fplot_core::filled_plot_data::set_draw_against_y2 |
Sets a value determining if the data should be plotted against the secondary y-axis.
| [in,out] | this | The filled_plot_data object. |
| [in] | x | Set to true if the data should be plotted against the secondary y-axis; else, false to plot against the primary y-axis. |
Definition at line 7627 of file fplot_core.f90.
| real(real64), dimension(:,:), allocatable fplot_core::filled_plot_data::m_data |
The data set (column 1 = x, column 2 = y, column 3 = constraint y)
Definition at line 7591 of file fplot_core.f90.
|
private |
Plot against the secondary y-axis.
Definition at line 7589 of file fplot_core.f90.